Forecasts built for decision makers, not data scientists.
Powered by a breakthrough in forecasting science, Targeted Seasonal Forecasts deliver daily predictions with month-long horizons — and quantified confidence in every single value. The proprietary library of irregular seasonal models reveals objective patterns in the historical data. Each forecast value is selected from at least 800 different forecast models, based on historical patterns of accuracy.


Traditional forecasts predict numbers, not decisions. They leave you to interpret what’s normal.
Every merchant runs out of stock or over-orders because their “forecast” is a spreadsheet, not a signal.
The TSF Soultion: One Forecast. Every Cadence. Every Decision.
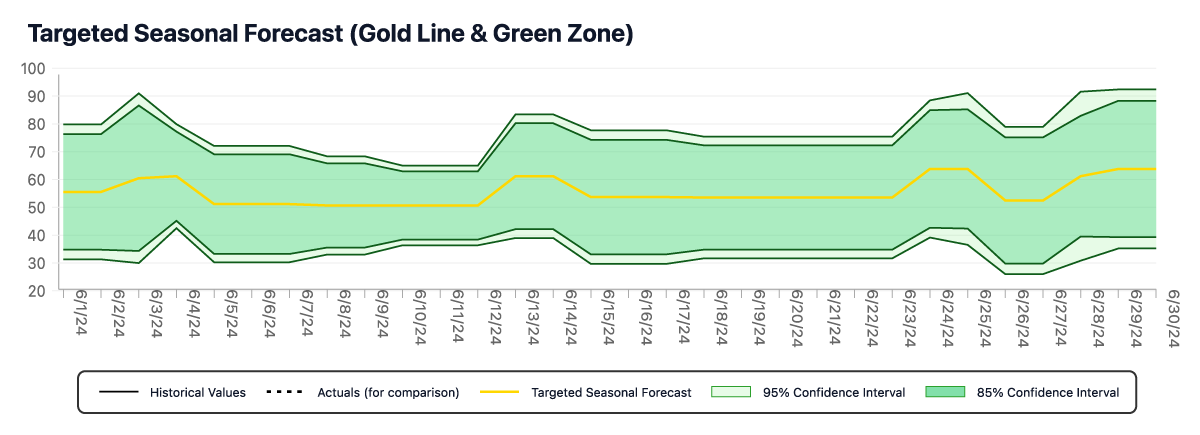
At the start of each month, TSF gives you a forecast like this — the gold line shows your expected daily sales, and the green zone marks what’s considered normal. The upper edge is your planning line: stock or produce enough to cover everything inside that band.

As the month begins, your actual sales (the dotted line) appear automatically on the same chart. You can see at a glance whether performance is on pace, soft, or trending hot.
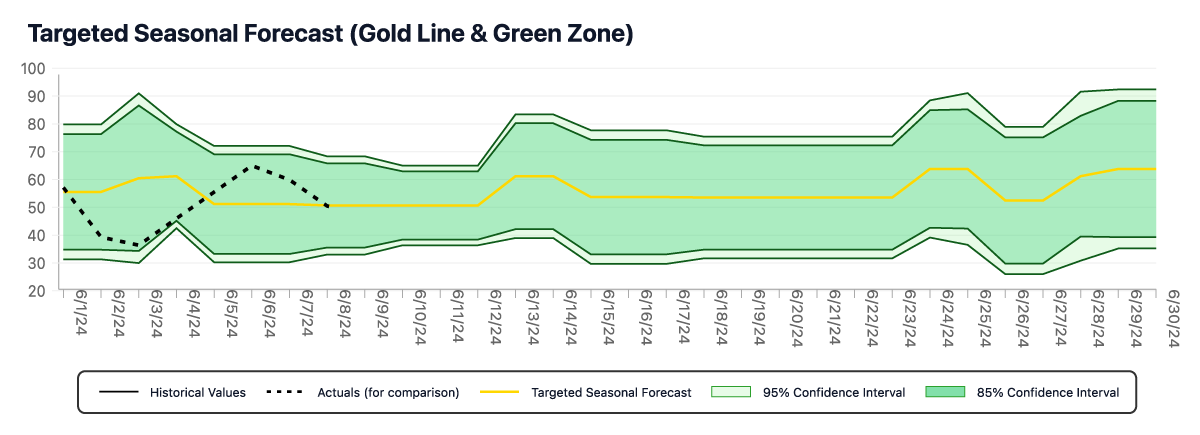
If actuals stay inside the green zone → you’re on plan.
If they press the upper edge → reorder early.
If they fall toward the bottom → hold or scale back.
That’s the whole process—no analysis, no dashboards full of noise, just a single chart that updates itself every day.
See TSF in Action
Fewer Stockouts. Less Overstock. No Guessing.
Start each month with clarity.
The green zone defines your safe operating range for each day — your best- and worst-case expectations based on real data.
Watch volatility, not just direction.
When the band widens, expect more variability — it's your signal to build flexibility into cash flow or supply.
Plan inventory, ads, and staffing within the band.
The top of the band is the strong demand scenario. The bottom of the band is the conservative scenario. Plan your orders and budgets around the range that fits your risk tolerance.
Measure signal vs. noise.
If actual results stay inside the band, you're fine. If they consistently move above or below it, something has genuinely changed — that's a planning insight for next month, not a daily fire drill.
Built for Shopify Merchants
Set up once. Forecast forever.
Connect your Shopify store, pick your products, and TSF Lite does the rest. Forecasts run automatically, uploaded and delivered straight to your dashboard each month.
TSF Lite App
Case Study Program
Run your business with foresight, not forecasts. Join the TSF Lite Case Study Program.
Apply to Join the Case Study Program
Discover the Science
TSF forecasts use the Model of Temporal Inertia to achieve what traditional forecasts can’t.
Explore the Science
Invest in the Future
Partner with TSF to bring next-generation forecasting to every data-driven business.
Investment Opportunity
Stop guessing. Start forecasting.
Join the early access list and get your first forecasts the moment TSF Lite launches.
TSF Lite is currently in pre-release. Early access merchants receive:
- First access to the app at launch (early 2026)
- Locked-in beta pricing
- Priority consideration for Shopify case-sudy selection
Blog
Lorem Ipsum is simply dummy text of the printing and typesetting industry.
Lorem Ipsum has been the industry's standard dummy text ever since the 1500s


January 03, 2021
Convincing reasons you need to learn
Lorem Ipsum is simply dummy text of the printing and typesetting industry. ....


January 03, 2021
The five devices you need to work anytime
Lorem Ipsum is simply dummy text of the printing and typesetting industry. ....


January 03, 2021
Tiktok Illegally collecting data sharing
Lorem Ipsum is simply dummy text of the printing and typesetting industry. ....
Want more information?
Lorem ipsum dolor sit amet, consectetur adipiscing elit.
Make your call to action here.
Lorem ipsum dolor sit amet, consectetur adipiscing elit.