How Smarter Demand Planning Turns Data into Profit
A practical guide for Shopify merchants on how demand planning protects cash flow, prevents stockouts, and scales smarter — and how TSF Lite makes it effortless.


Introduction: Why Forecasting Isn’t Optional Anymore
For a long time, small and mid-sized e-commerce merchants treated forecasting as something only big
companies worried about. But once you’ve had a few hot products sell out too soon — or a stack of unsold
inventory eating your margins — you learn that guessing is expensive.
Demand planning is simply the process of anticipating what your customers will want and when they’ll want
it, so you can align your purchasing, marketing, and fulfillment decisions. The goal isn’t to predict the future
perfectly — it’s to make sure your money is in motion instead of sitting idle in the wrong inventory.
When done right, it touches everything: revenue, profit, cash flow, and customer satisfaction. When done
wrong, it quietly drains all four.
The Hidden Cost of Inventory Guesswork
Inventory is usually your largest investment. Every extra case or SKU you order represents cash tied up on
the shelf — cash that could be paying for marketing, staff, or growth.
- Overstocking locks up working capital and increases carrying costs (storage, aging, markdowns).
- Understocking means missed sales, frustrated customers, and broken momentum when products are suddenly unavailable.
- Erratic buying makes supplier relationships unstable and shipping costs unpredictable.
These problems compound quietly. A few percentage points of bad timing on each SKU can add up to
thousands of dollars lost each month.
Good demand planning doesn’t just reduce mistakes — it builds predictability. It gives you a rhythm:
knowing what’s safe to reorder, when to slow down, and how much flexibility you really have.
What Demand Planning Looks Like in Practice
For a typical Shopify merchant, a demand plan usually revolves around three recurring tasks:
1. Understanding your sales pattern.
Looking back over 12–24 months of daily sales to see what’s seasonal, what’s random, and what’s consistently growing.2. Translating that pattern into forecasts.
Deciding what ”normal” looks like next month and how much deviation you can afford to risk.3. Making stock and marketing decisions around those forecasts.
Ordering inventory, scheduling ads, or planning promotions based on how confident you are that demand will stay within a certain range.This doesn’t require advanced math — just structure. Most merchants already have the data they need. The
challenge is turning that data into a forecast they can trust without hiring a data scientist.
Common Mistakes the Kill ROI
Even merchants who track their numbers closely often stumble into these pitfalls:
Relying on averages.
Simple trend lines ignore volatility. You end up planning for the middle and missing the peaks and valleys that drive profit.Not separating product behavior.
One SKU might spike every 90 days, another every weekend. Aggregating them together hides their real patterns.Ignoring uncertainty.
Every forecast has risk, but most tools only show one number. Without a range, you can’t tell what’s safe vs. speculative.Failing to update often enough.
Forecasts built once per quarter go stale fast. Customer behavior shifts weekly, sometimes daily.Each of these mistakes erodes ROI because they push you to overreact — buying too much, or holding back
when demand was actually climbing.
Turning Forecasts into ROI
When you bring structure and consistency to forecasting, the ROI shows up in three areas:
1. Cash Flow Efficiency
You’re investing only where it pays off. Less idle stock means more liquid capital for ads or product development..2. Operational Stability
Smoother purchase cycles reduce rush orders and last-minute shipping costs.3. Strategic Confidence
With clear forecasts, you can plan promotions or seasonal campaigns months in advance without guessing.The math is simple: fewer surprises = higher margin.
Where Most Tools Fall Short
The problem isn’t that small merchants lack data — it’s that most forecasting tools treat their data like it
belongs to a Fortune 500 company. They assume you have analysts, time, and context to interpret abstrac t
models.
So they give you charts and confidence scores without explaining what to do with them.
Traditional systems also depend on “trained” models — algorithms adjusted manually to fit your past data.
They perform well until your sales pattern changes (a new product line, a viral promotion, a new channel).
Then they fail quietly, and you don’t notice until it’s too late.
The TSF Approach: Forecasting That Works Like Merchants Think
TSF Lite takes a different path. Instead of fitting one big model to your data, it treats each day as a separate
forecasting problem.
For every date in your forecast window, TSF Lite compares up to 800 different forecast models — each
derived from a library of 10 seasonal models and 2 seasonal series, with 40 unique forecasts per combination. It selects the model that has proven most accurate for that specific date, based on historical performance.
The result is a forecast that moves with your business instead of flattening it.
The full TSF Engine uses an even larger Seasonal Model library — more than 25 seasonal models, each with
3 seasonal series, generating over 3,000 unique forecast models for monthly forecasts and another 3,000 for
quarterly forecasts. Not every seasonal model is appropriate for every dataset, but the library ensures that
TSF can handle everything from 2 years to 20 years of historical data.
The output is visual and immediate. The gold line shows your daily expected sales. The green zone shows your 85–95% confidence range — your safe planning window.

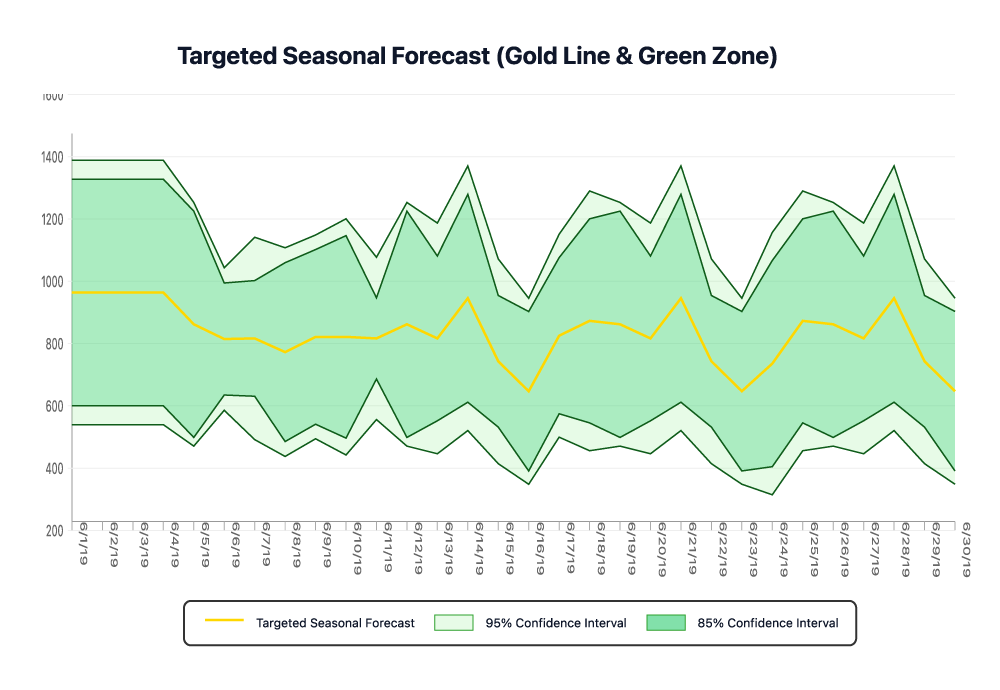
You can read it at a glance: if your sales stay inside the green, your plan is sound. If they break out of it, you
know exactly where to adjust.
Behind the scenes, this process is 100% objective — no subjective tuning, no overfitting. Every choice is based on historical accuracy patterns across your own data sets.
How This Converts to ROI for You
For a typical Shopify merchant, a demand plan usually revolves around three recurring tasks:
1. Faster decisions.
You spend minutes reviewing forecasts, instead of hours analyzing spreadsheets.2. Reduced risk.
You can hold less inventory without fearing stockouts because you know your safe range.3. Improved margins.
Less overstock means less capital trapped on the shelf — which compounds every month.4. Marketing alignment.
Run promotions and ads against forecast windows you can trust. Sell more when confidence is high; conserve when it's not.The payoff isn’t theoretical. Even modest improvements in forecast accuracy translate directly into cash flow
and gross margin. For many merchants, a 5% improvement in forecast accuracy can mean 10–15% more
usable cash each month.
Conclusion: Predictability Is the Real Superpower
You don’t need to predict the future to win in e-commerce. You just need to remove the guesswork from
your next 30 days — or 90, if you opt for quarterly forecasts.
Demand planning turns data into control — and with TSF Lite, that control becomes automatic.
Start using your own data as a compass instead of a mystery. The green zone will tell you when to act, the
gold line will show you where you’re headed.