
Turn Data Into Decisions
TSF Demand is a fully managed planning service that connects to your existing data and delivers real-time decision signals, automated forecasts, and weekly actionable reports — with no analysts, no AI, and no guesswork.
TSF is not an AI-powered forecasting tool that guesses what the next number will be. TSF is a decision framework that tells you when to act.
TSF translates complex data into clear direction. It builds a “map of normal” so you can monitor current conditions. When current conditions are normal, you hold. When current conditions are not normal, action is required. TSF alerts you in real time when conditions change.
TSF tells you at a glance whether this moment is normal or not — and when it’s time to hold, grow, or protect.
Your Complete Planning Service
TSF Demand connects to your existing POS or ERP data stream with an API.
Put more simply, we’ll connect to your existing data stream and take it from there. We’ll download all of your historical data, build out the monthly forecast maps, and then make sure your live data updates every day on the dashboards giving you real-time signals that tell you when to act.
TSF Demand is 100% automated and 100% objective. Unlike legacy forecasting models that require training and testing and need a human (or AI) analyst to tune a single forecast model to guess what the next number will be, TSF compares up to 800 different forecasts for each value and then selects the forecast with the best historical pattern of accuracy for that date.
The biggest cost of legacy forecast models is that even when driven by AI and machine learning, they can forecast only a single period at a time. They can tell you what the next number will be, but they can’t tell you what the number after that will be because the margin of error for each additional forecast grows exponentially.
Temporal Structural Forecasting is a revolutionary new approach that can produce daily forecast values a full month in advance with no loss of confidence.
Because TSF is 100% automated and 100% objective, it can generate forecasts on an industrial scale. Every single SKU, every single entity, gets its own forecast and its own map of normal. Every forecast category and every cross-section gets its own forecast using the SKU-level data. TSF Demand generates tens of thousands of individual forecasts on your data, automatically and invisibly. You get a view of the month ahead that you can trust and real-time signals that tell you when to act.
The Temporal Structural Forecasting model requires no artificial intelligence, ever, because it doesn’t have to search for patterns in the data that don’t actually exist. TSF uses a library of more than 80 complex, irregular seasonal models to reveal objective structural patterns in time itself. Think of the seasonal models as different lenses in a Microscope for Time. When you view time series data through these proprietary seasonal lenses, you can see patterns and structure that aren’t visible with the naked eye — or detectable with even the most advanced machine learning forecast tools.
You can learn more about how Temporal Structural Forecasting differs from legacy forecasting models used by AI-based forecasting tools in the methodology section.
TSF Demand is not a forecasting tool — it’s a Decision Framework.
Every legacy forecasting tool gives you a number, and then you have to figure out what the number means. But the situation is much worse than that. By the time you’ve trained and tuned the forecast model, analyzed the data, and decided what the number actually means, it’s no longer relevant. The forecast number was based on old data and the best it can do is tell you what action you should have taken last week. Legacy forecasting tools claim to look ahead, but they actually look in the rear-view mirror.
TSF doesn’t try to predict the future because predicting the future is impossible. TSF builds a map of normal that tells you where the actual values should fall under normal conditions. The TSF forecast chart consists of a gold line and a green zone. The gold line is the actual forecast value selected by comparing the historical patterns of accuracy of up to 800 different forecast models for that date. The green zone is the confidence band derived from those same historical patterns of accuracy.
Every day, you monitor the actual values as they plot on top of the map of normal. If the actual values fall within the green zone, conditions right now are normal and no action is required. You’ve planned for these exact conditions. If the actual values break the bands and fall outside of the green zone, it’s not an error, it’s a signal — conditions right now are not normal. You need to take action now. Depending on the signal, you may need to grow and take advantage of an immediate opportunity or to protect and stop a spark from turning into a five-alarm fire.
Legacy forecasting tools can only tell you what the next number will be. TSF Demand tells you when to act.
Dashboards are deceptive. Looking at dozens of brightly-colored charts and graphs gives a false sense of confidence that you’re making informed decisions based on supported data, but that’s not at all true. Dashboards merely dress up the rear-view numbers and then compare them to other rear-view numbers. Legacy dashboards still can’t tell you what’s happening now or when you need to act.
The TSF Dashboards are different. The forecast chart — the map of normal — tells you at a glance if now is normal. The dashboard accesses and aggregates every individual SKU-level forecast, and includes clear, actionable signal information that tells you exactly when conditions changed, for which domains, and the nature of the signals.
One click generates a complete weekly report — every domain, every SKU category, every signal that fired that week, with clear action priorities. Now your analysts can focus on what actually matters: understanding what changed and what to do about it.
With legacy forecast models, you spend your time exploring why the number was wrong. With TSF's clear, signal-based reporting, you stop asking what the number means and start acting on what it tells you.
TSF Demand vs Legacy Forecasting Tools
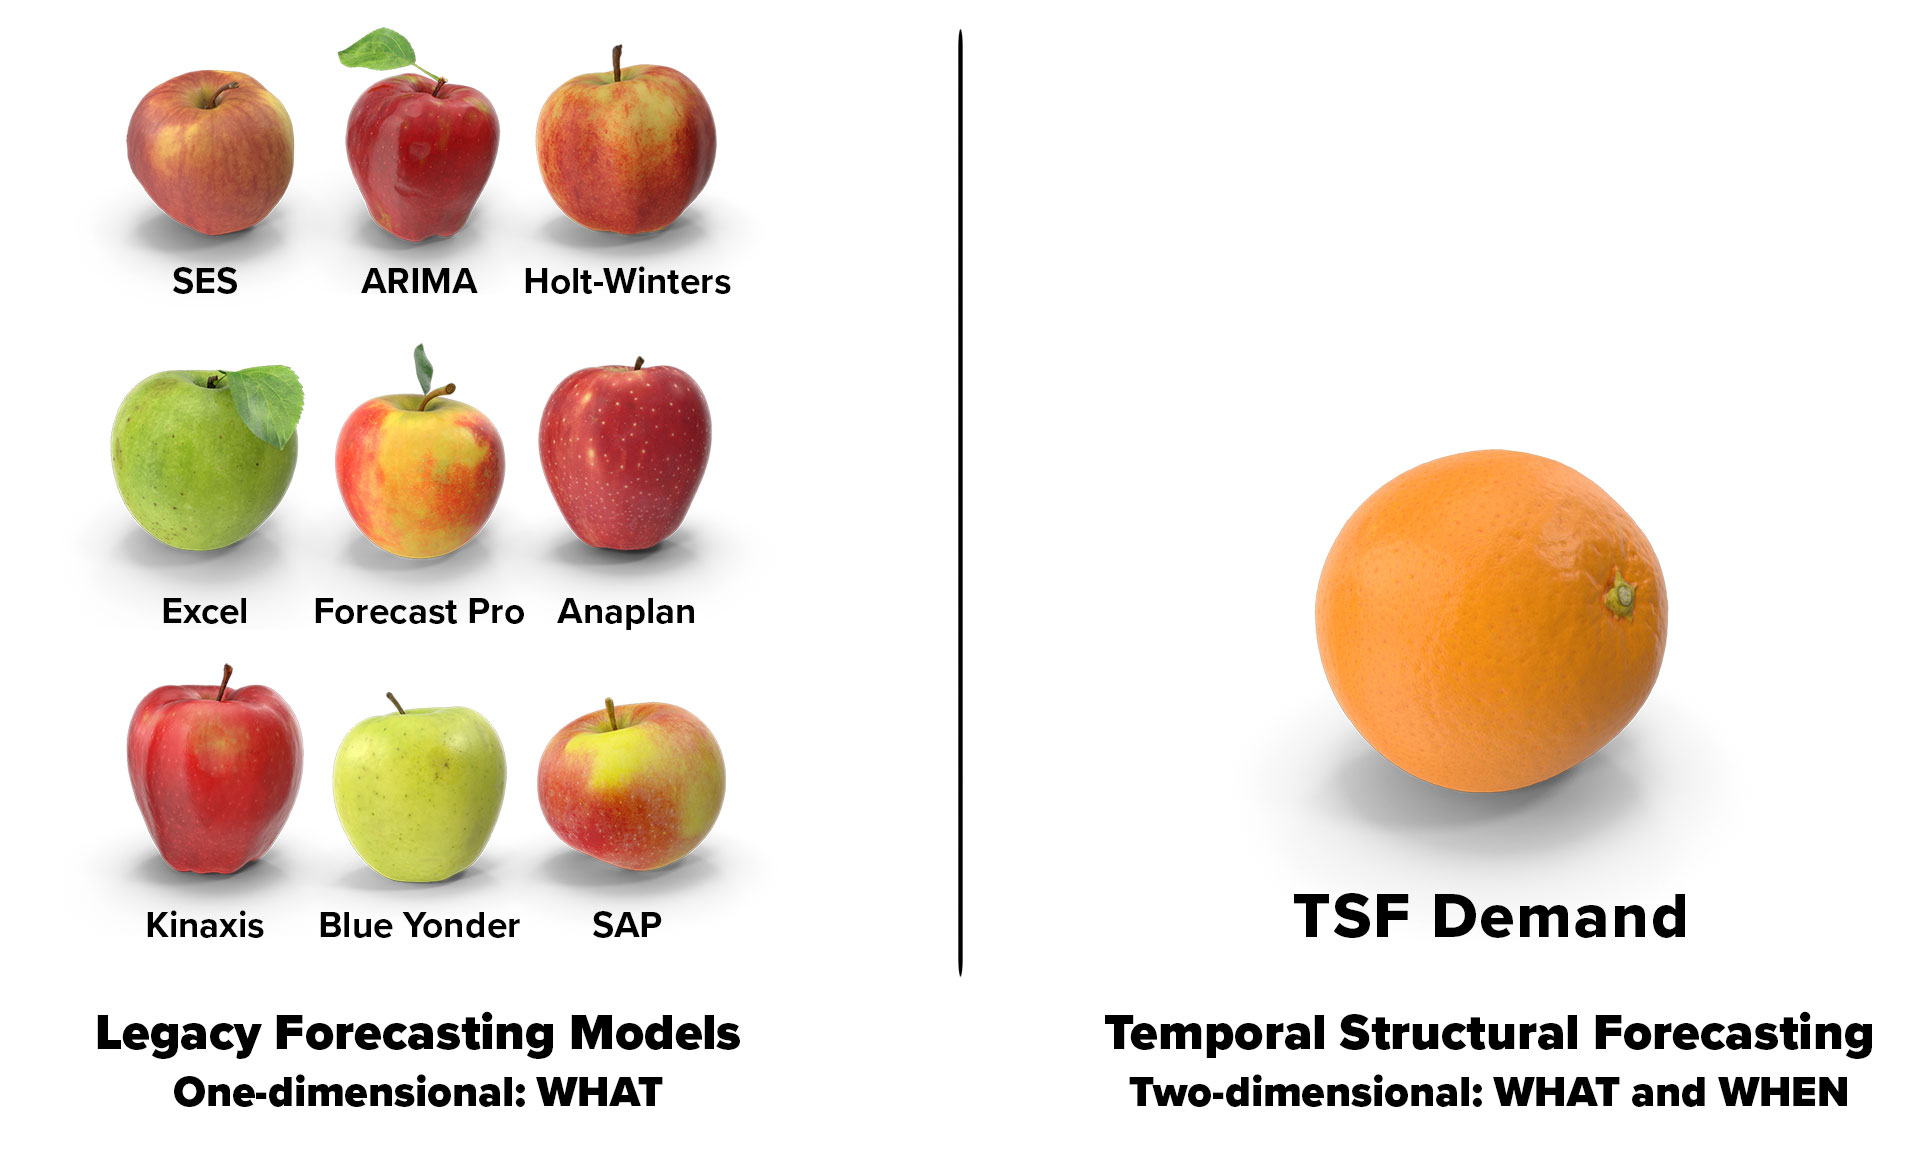
Legacy forecasting tools, used in every forecasting platform and including everything from simple moving averages to the most advanced AI-powered machine learning models, are univariate (they predict a single value using only the historical values of that variable) and one-dimensional: they can only tell you WHAT the next number will be. TSF Demand is univariate and two-dimensional: it tells you both WHAT the next number will be and WHEN it will change. Legacy forecasting tools can't tell you WHEN to act because legacy forecasting tools are one-dimensional and can't consider the dimension of time.
The TSF forecast methodology is Temporal Structural Forecasting. This approach is based on the Model of Temporal Inertia, which forecasts along two timelines rather than one. Complex irregular seasonal models act as lenses in a microscope for time, revealing time-based structural patterns in data that are impossible to see with the naked eye. Historical patterns of accuracy of each forecast strategy create a "map of normal" that describes what the actual values should be each day.
When actual values fall outside of the green zone confidence bands, it's not an error, it's a signal. Conditions right now are not normal. It's time to act now.
The forecast methodology is presented in the Methodology section. Preprint results of the preregistered research studies on these data are available in the Research section.
Put TSF Demand to Work Across Your Organization
Sales & Operational Planning
Know which SKUs need attention before your next S&OP meeting. TSF delivers SKU-level signals that identify demand shifts the moment they happen. Your planning conversations start with what's changing now, not what went wrong last month.
Impact Analysis
Every intervention lands on top of baseline demand conditions you have never been able to measure. TSF gives you that baseline. For the first time, you know what normal looks like, which means you know what your interventions actually did.
Capacity Planning
Demand for your resources follows structural patterns your current tools can't see. TSF maps normal capacity demand and fires real-time alerts when conditions shift. With TSF, you staff, schedule, and allocate ahead of the curve instead of behind it.
Procurement Timing
Most procurement decisions are made on schedule. TSF replaces the schedule with a signal: a live measurement of where any price sits relative to its own structural baseline. When the signal fires, the price is abnormally low. That is when you buy.
See What TSF Demand Can Do For Your Business
Every TSF Demand engagement starts with a free consultation. We review your data environment, walk through your planning needs, and give you a clear picture of what the service would look like for your business. You decide what happens next.