A Microscope for Time
Targeted Seasonal Forecasts combine the Model of Temporal Inertia with a proprietary library of complex, irregular seasonal models. These seasonal models function as lenses in a Microscope for Time — they reveal patterns in data that are invisible to the naked eye.

The worlds of business and finance must be able to see the future.
Success in these fields requires the ability to anticipate how conditions will change and when those changes will happen. The problem is that human beings have a limited perception of time; we can perceive the past, but we can’t perceive the future. The science of statistics, and specifically the branch of data science concerned with time series forecasting, exists to address this limitation and provide brief, actionable glimpses of the future. Billions of dollars are being spent on advanced mathematical models and cutting-edge computations including neural networks, machine learning, and of course, AI, all in pursuit of an expanded, more detailed, and more precise view of the future. However, none of these strategies address the fundamental problem of the limited ability humans have to perceive the dimension of time.
Science relies on objective observation. We can’t understand something if we can’t see it. Sometimes we need new tools to help us to see things that are invisible to the naked eye.
Before the invention of the microscope, the concept of a biological cell didn’t exist.
Robert Hooke, a British scientist with an impressive resume of discoveries, coined the term “cell” after viewing a thin slice of cork under a microscope. Hook stated in 1665, “…by the help of Microscopes, there is nothing so small as to escape our inquiry; hence there is a new visible World discovered to the understanding.” The invention of the microscope made the entire science of microbiology possible, and has led to countless advancements in chemistry and physics.
Time series forecasting predicts future outcomes by considering historical data. A pattern in the past is expected to continue in the future. All existing time series forecasting tools look for patterns in the historical data and base their forecasts on those patterns.
To be able to forecast with patterns we must be able to see those patterns. Currently, we’re able to identify patterns only when they present as repeated sequences of peaks and troughs in the historic data, which we call “seasonality.” We expect these sequences to correspond with equal divisions of the calendar or the clock, which is how we understand time. More advanced forecast models look for other types of correlations among the data, but metaphorically, we’re still looking for patterns in the data with the naked eye.
Think of the Model of Temporal Inertia as a Microscope for Time
When you view a drop of water through the lens of a microscope, you can see a world of single-cell organisms that are otherwise invisible. When you view time series data through the lens of the complex, irregular seasonal models that I’ve developed, you can see patterns and cycles that are otherwise invisible. Those patterns allow us to see further into the future with greater detail, precision, and confidence than possible with any existing tool.
We think of time as a single timeline, the sequential timeline, which is an unbroken, chronological sequence of events. All existing forecast models forecast along the sequential timeline. On the sequential timeline, Season 8 of 2025 follows Season 7 of 2025, which follows Season 6 of 2025. The Model of Temporal Inertia considers two timelines: the sequential timeline and the seasonal timeline. On the seasonal timeline, Season 8 of 2025 follows Season 8 of 2024, which follows Season 8 of 2023.
We can understand time only when it’s expressed in terms of the calendar or the clock; but the calendar and the clock are not the only ways to measure time.
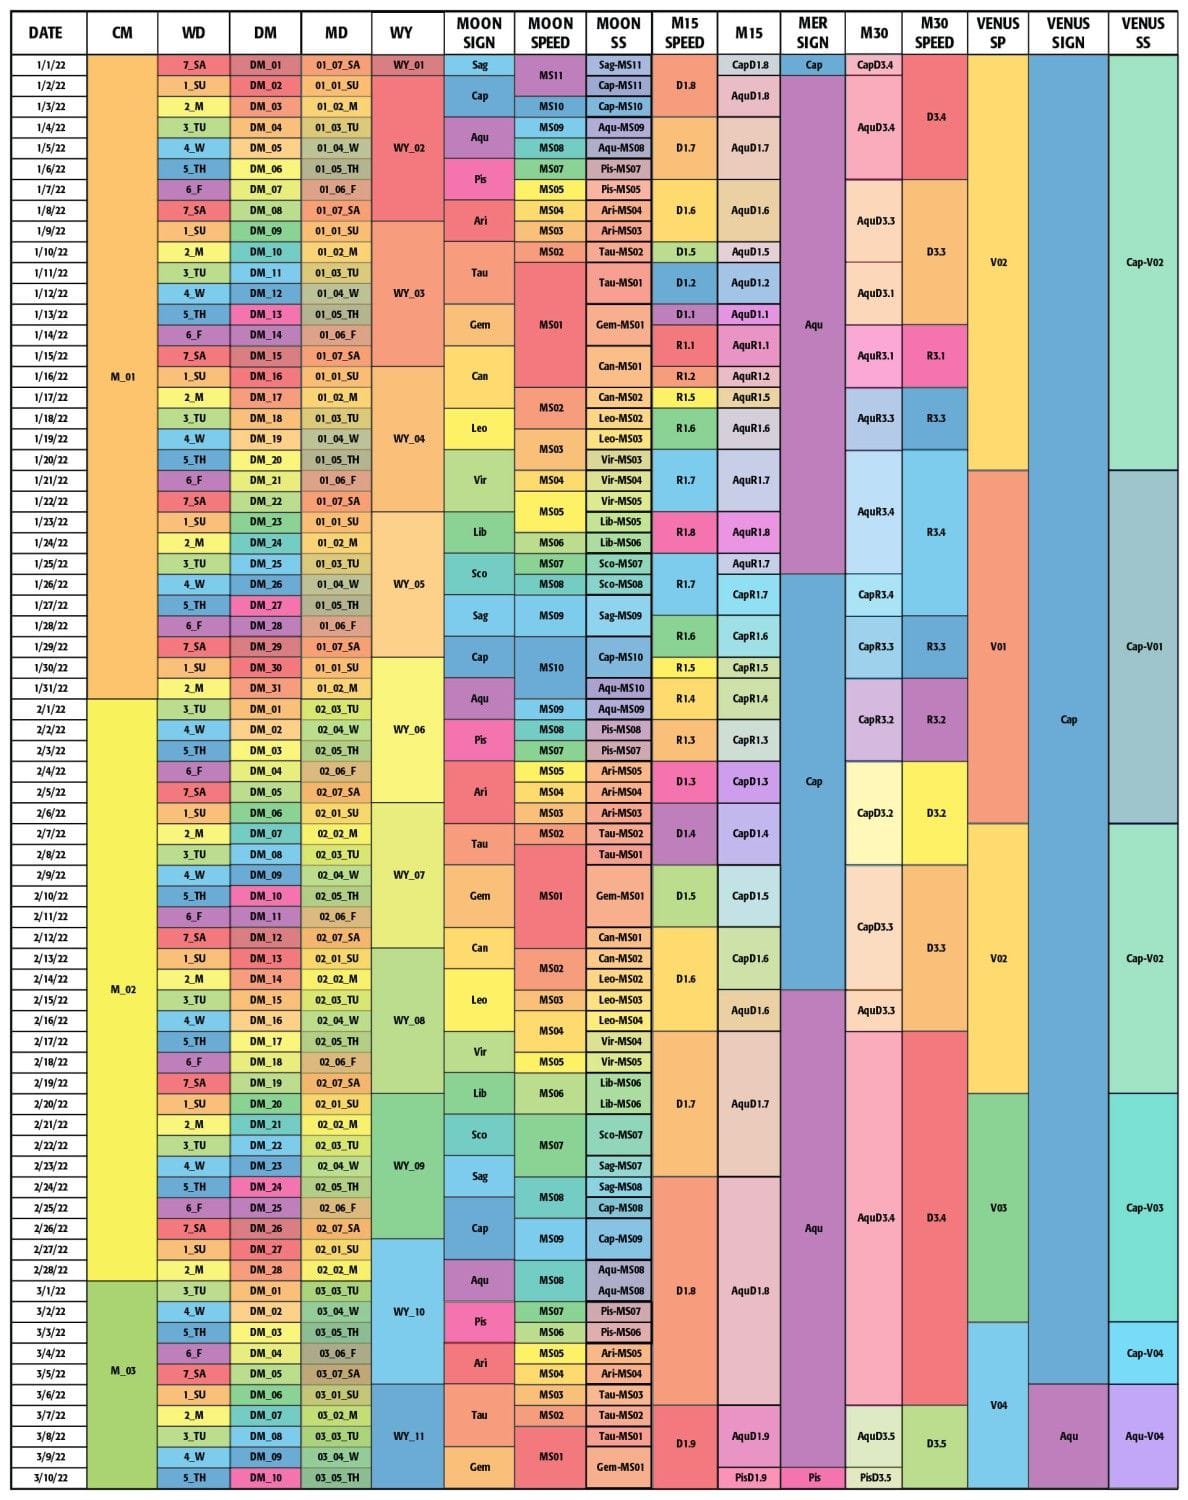
Complex, irregular seasonal models must be configured in a matrix that maps the seasons of each seasonal model to specific dates of the calendar.
This is a graphic representation of a seasonal matrix for most of Q1 2022, showing the 16 seasonal models used in my original research. The individual calendar dates from January 1, 2022 through March 10, 2022 are listed down the left column. The individual seasons of each seasonal model are color-coded to highlight the varying durations of each season and to make the divisions between seasons more obvious.

I’ve discovered a literal universe of seasonal models that is ready to be explored.
Think of each seasonal model as a lens in the microscope for time. We simply view the time series data through different combinations of lenses until the hidden patterns in the data come into focus.
With the TSF Lite application, each day’s forecast value is selected from 800 independent forecast models — the result of combining 10 seasonal models and 2 seasonal series, each producing 40 different forecasts per combination. The system evaluates each forecast’s historical accuracy and selects the model with the strongest record of performance for that specific date.
The full TSF Engine — the foundation of all products — includes more than 25 seasonal models, each with 3 seasonal series, creating over 3,000 forecast models for monthly forecasts and another 3,000 for quarterly forecasts. Each model is evaluated objectively; none are trained or tuned subjectively.