Foresight, automated.
TSF Lite delivers updated, ready-to-use forecasts every month — automatically. Get a clean, visual forecast for every SKU, complete with safe green-zone confidence bands and easy-to-read data tables. Launching early 2026 — join the Beta to secure early-access pricing and case-study priority.
How to Use TSF Lite for SKU-level forecasts
This is what every merchant receives for each SKU at the start of the month — one clear, decision-ready forecast that defines what “normal” looks like before the month begins.

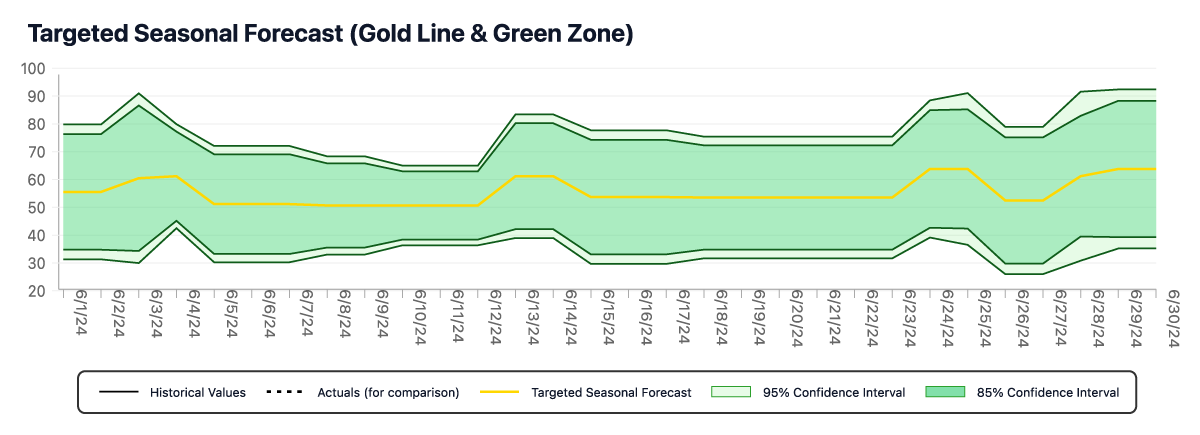
The gold line is the expected daily performance for the month ahead. Each point represents one day’s forecasted sales. The surrounding green zone shows the range of results that are still considered normal — the inner band (85%) for day-to-day operations and the outer band (95%) for high-confidence planning.
The green zone is your safe space for planning. The upper edge marks the highest level of demand still considered normal. Merchants use that line to plan inventory orders, production, or staffing for the next restock cycle. If your fulfillment window is weekly, you would look at the first seven days of this chart, note where the top of the green zone sits, and stock to that level. It means you’ll have enough product to cover every day that falls within normal demand.
Unlike a traditional forecast that gives you a single number and leaves you to guess, this chart shows you the full range of what’s likely — and where confidence begins and ends.
That one chart gives you daily granularity, weekly visibility, and the full monthly picture in a single view.
You don’t need four separate forecasts — the same green zone supports daily monitoring, weekly restocks, and monthly planning. One forecast becomes the single source of truth for every decision.
In the next image, you’ll see how actual results begin to fill in over the first week. The dotted black line represents your actual daily sales, updated automatically each day. This overlay shows exactly where you stand relative to your forecast: whether performance is comfortably inside the green zone, pressing its upper edge, or breaking above it. Those positions guide your Week 2 order — if you’re trending near the upper edge, it’s time to confirm your next restock early.
Week 1 Results: Reading the Actuals
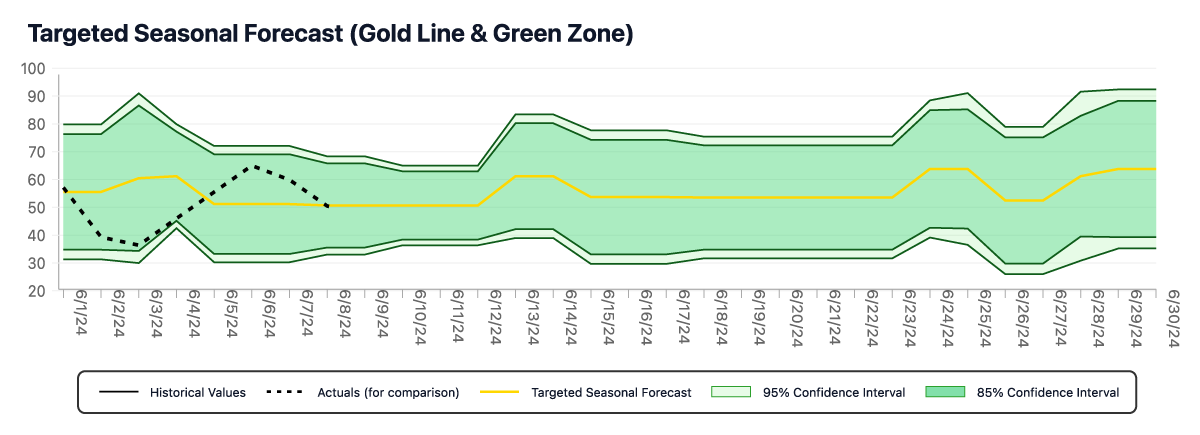
As the first week’s actual sales (the dotted black line) fill in, you can immediately see how performance compares to the green zone that defines “normal.”
Early in the week, sales dipped toward the bottom of the green zone—a soft start, but still within the expected range. By mid-week, the line recovered toward the center before sliding again near the weekend.
For a merchant, this pattern translates into a few simple response options:
- Stay calm early: the dip remained inside the zone, so it isn’t a red flag. Hold your existing restock plan; don’t cut orders yet.
- Check your marketing or exposure: when actuals recover mid-week, that suggests demand responds to normal promotion rhythm—nothing structural is wrong.
- End-of-week softness: if the second drop continues into next week, pause or scale back your upcoming order slightly until sales move back toward the middle of the band.
- If sales fall below the band: that’s when you’d reduce the next order, slow ad spend, or run a small promo to lift demand back inside the zone.
Week 2 Results: Trend Toward the Upper Edge
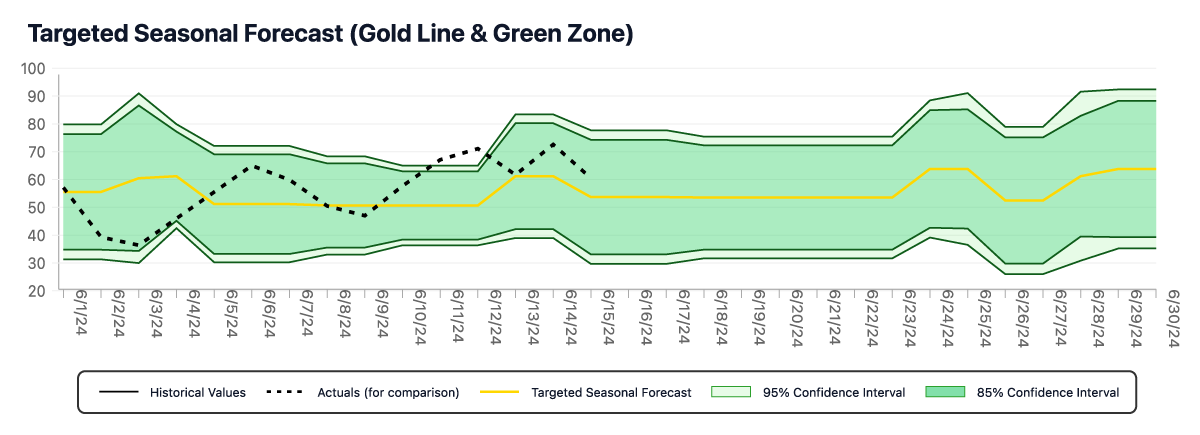
As the second week fills in, the dotted black line of actuals climbs through the center of the green zone and presses toward its upper edge. That shift shows demand strengthening—still normal, but running hotter than the baseline forecast.
For a merchant, this is the early reorder signal. You don’t wait for a stock-out or a red-flag alert; the chart itself tells you that you’re trending high inside the expected range.
Your options now:
- Advance your next order. Confirm or release the top-up you prepared on day 1 so it arrives before the next restock window.
- Keep marketing steady. There’s no need to throttle ads yet—this is healthy demand inside the band.
- Hold a close watch. If actuals cross the upper edge on consecutive days, that’s the cue to trigger surge protocol: reorder again or shift inventory from slower SKUs.
The chart makes this behavior obvious—without analysis, without recalculating forecasts. You just read where you are relative to the zone and act accordingly.
Week 3: When Actuals Break Above the Green Zone
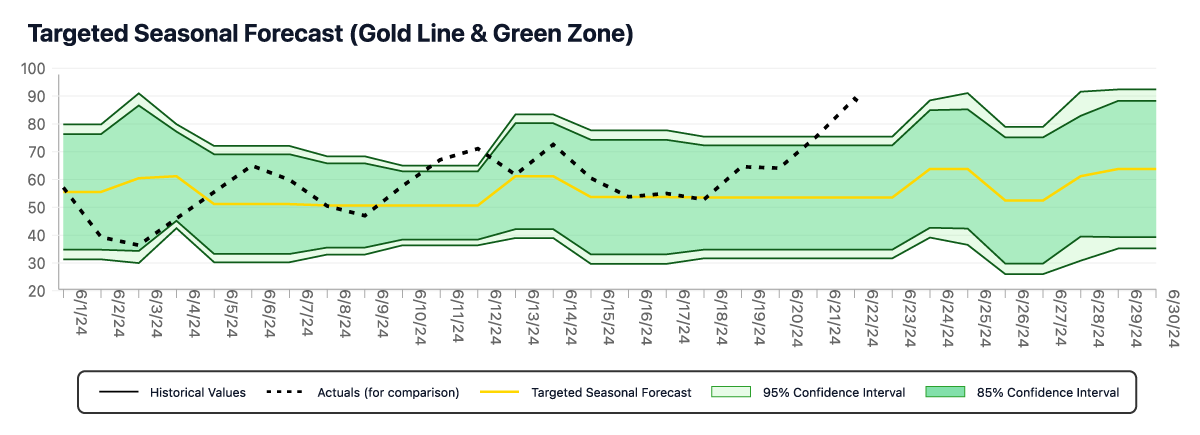
By the third week, the dotted black line — actual sales — pushes through the top of the green zone. That’s no longer “normal.” The forecast said results this high were unlikely even at the 95% confidence level, which means real demand has broken pattern.
For a merchant, that’s a signal to act, not panic. You’ve already covered your baseline with stock planned to the upper edge, so you’re safe for a few days — but this is where the surge protocol starts.
Your options now:
- Trigger your top-up order immediately. Don’t wait for confirmation; demand is already outside the forecast range.
- Rebalance inventory. If you manage multiple SKUs, shift stock or ad spend from slower movers to this one.
- Hold promo activity. Pause discounts or campaigns until supply catches up — protect availability first.
- Keep watching. If actuals reenter the green zone, you’re back in normal territory; if they stay high, you can treat the new level as the baseline for next month’s forecast.
The charts never changed — you did.
The forecast defined normal at the start of the month; your actions adapt as the actuals move through it.
One chart, one rule, real-time awareness.
Join the TSF Lite Beta
Why demand planning is the difference between guessing and growing.
Even small forecasting errors add up — overstock ties up your cash, understock costs you sales, and
both make promotions unpredictable. TSF Lite keeps you inside your safe range, so you can plan reorders,
marketing, and cash flow with confidence.
It's not about more data — it's about knowing when to act.
Learn how to use demand planning to drive ROI
Fewer Stockouts. Less Overstock. No Guessing.
Start each month with clarity.
The green zone defines your safe operating range for each day — your best- and worst-case expectations based on real data.
Watch volatility, not just direction.
When the band widens, expect more variability — it's your signal to build flexibility into cash flow or supply.
Plan inventory, ads, and staffing within the band.
The top of the band is the strong demand scenario. The bottom of the band is the conservative scenario. Plan your orders and budgets around the range that fits your risk tolerance.
Measure signal vs. noise.
If actual results stay inside the band, you're fine. If they consistently move above or below it, something has genuinely changed — that's a planning insight for next month, not a daily fire drill.


Built for Shopify Merchants
Set up once. Forecast forever.
Connect your Shopify store, pick your products, and TSF Lite does the rest. Forecasts run automatically — updated and delivered straight to your dashboard each month.
- One-click Shopify integration
- Automated monthly forecasts (delivered 1st of every month)
- Optional quarterly upgrade (90-day rolling forecasts)
- Transparent pricing — less than $4 per SKU/month
Reserve your spot
The First Forecasts Built on a Scientific Breakthrough
Traditional forecasting models operate on a single timeline — each day’s value depends on the one before it. That means when reality shifts mid-month, their forecasts can’t keep up; the curve is already locked into yesterday’s assumptions.
The Model of Temporal Inertia (MTI) changes this. TSF forecasts operate on two timelines at once — a sequential timeline for short-term continuity and a seasonal timeline that maps recurring patterns across years. This structure lets each daily forecast value stand independently, so the model can recognize and capture changes within the forecast period instead of missing them.
That independence is what makes TSF capable of producing 30-, 60-, and 90-day forecasts with measured confidence and within-period adaptability — something traditional forecasting simply can’t do.
Learn the science
Be a part of the first wave of TSF Lite case studies.
We're selecting a small group of Shopify merchants to join the TSF Lite case study program — spanning a range of industries, catalog sizes, and data histories. As a participant, you'll receive personalized forecasts and direct guidance during the beta test phase, helping shape how TSF Lite performs in real-world use.


Simple, transparent pricing.
TSF Lite is priced to make enterprise-grade forecasting accessible to every Shopify merchant. Choose the plan that fits your catalog size — each includes 30-day forecasts, two confidence bands, and full access to your data table.
Starter 50
$
4.00
/SKU (avg)
Up to 50 SKUs
Free trial gives immediate access to 6 months of historical forecasts and 1 month of actual forecasts for 10 SKUs.
$200/month subscription.
Join the Beta
Pro 250
$
3.60
/SKU (avg)
Up to 250 SKUs
Free trial gives immediate access to 6 months of historical forecasts and 1 month of actual forecasts for 10 SKUs.
Quarterly Upgrade: Add extended 90-day forecasts with daily visibility.
$900/month subscription
Join the Beta
GROWTH 100
$
3.80
/SKU (avg)
Up to 100 SKUs
Free trial gives immediate access to 6 months of historical forecasts and 1 month of actual forecasts for 10 SKUs.
$380/month subscription.
Join the Beta
Stop guessing. Start forecasting.
Join the early access list and get your first forecasts the moment TSF Lite launches.
TSF Lite is currently in pre-release. Early access merchants receive:
- First access to the app at launch (early 2026)
- Locked-in beta pricing
- Priority consideration for Shopify case-sudy selection