
TSF Demand is a fully managed service. We connect directly to your data environment, build your forecast infrastructure, run your planning pipeline daily, and deliver structured reports on a cadence that fits your decision cycle. Nothing requires setup, maintenance, or oversight on your end.
Capacity planning determines how much of a resource to have available and when. The cost of getting the timing wrong runs in both directions: excess capacity is waste, insufficient capacity is a service failure.
Transportation and Logistics: Staffing, vehicle deployment, and route capacity must be aligned against structural patterns in ridership, shipping volume, or delivery load. Timing signals that identify when those patterns are shifting allow capacity adjustments before service levels are compromised.
Retail and Hospitality Staffing: Floor staff, kitchen capacity, and service coverage are scheduled against customer traffic patterns that vary by hour, day, and season. A lagging signal means overstaffing in slow periods and understaffing when traffic accelerates.
Healthcare: Bed capacity, staffing levels, and equipment availability must be matched to patient volume patterns by unit, shift, and season. Mistimed capacity decisions create bottlenecks that directly affect patient outcomes and operating costs.
Utilities and Energy: Grid capacity management, generation planning, and demand response all depend on accurate structural consumption patterns. Timing errors in either direction carry significant cost — and in peak demand scenarios, operational risk.
Manufacturing: Production line scheduling, shift planning, and raw material staging are all driven by order volume patterns. When structural shifts in demand go undetected, production capacity is misaligned before the order book reflects it.
Call Center and Service Operations: Agent staffing and queue capacity must track structural contact volume patterns by channel, hour, and day. Understaffing creates service failures. Overstaffing is pure cost. Both are the result of a demand signal that reacts instead of anticipates.
TSF Demand Capacity Planning Dashboard Example
The TSF Demand Dashboard gives you a live, real-time view of your Map of Normal — the confidence bands that define what demand should look like for every entity in your business at every point in time. Every forecast, every band, and every signal is visible at the entity level and across every aggregate dimension in your data.
The NYC Taxi & Rideshare dataset below shows the dashboard applied to a real-world capacity planning environment using publicly available NYC TLC trip record data. Explore the live version to see TSF forecasts across the full dataset — by service, by location, and across all time periods.
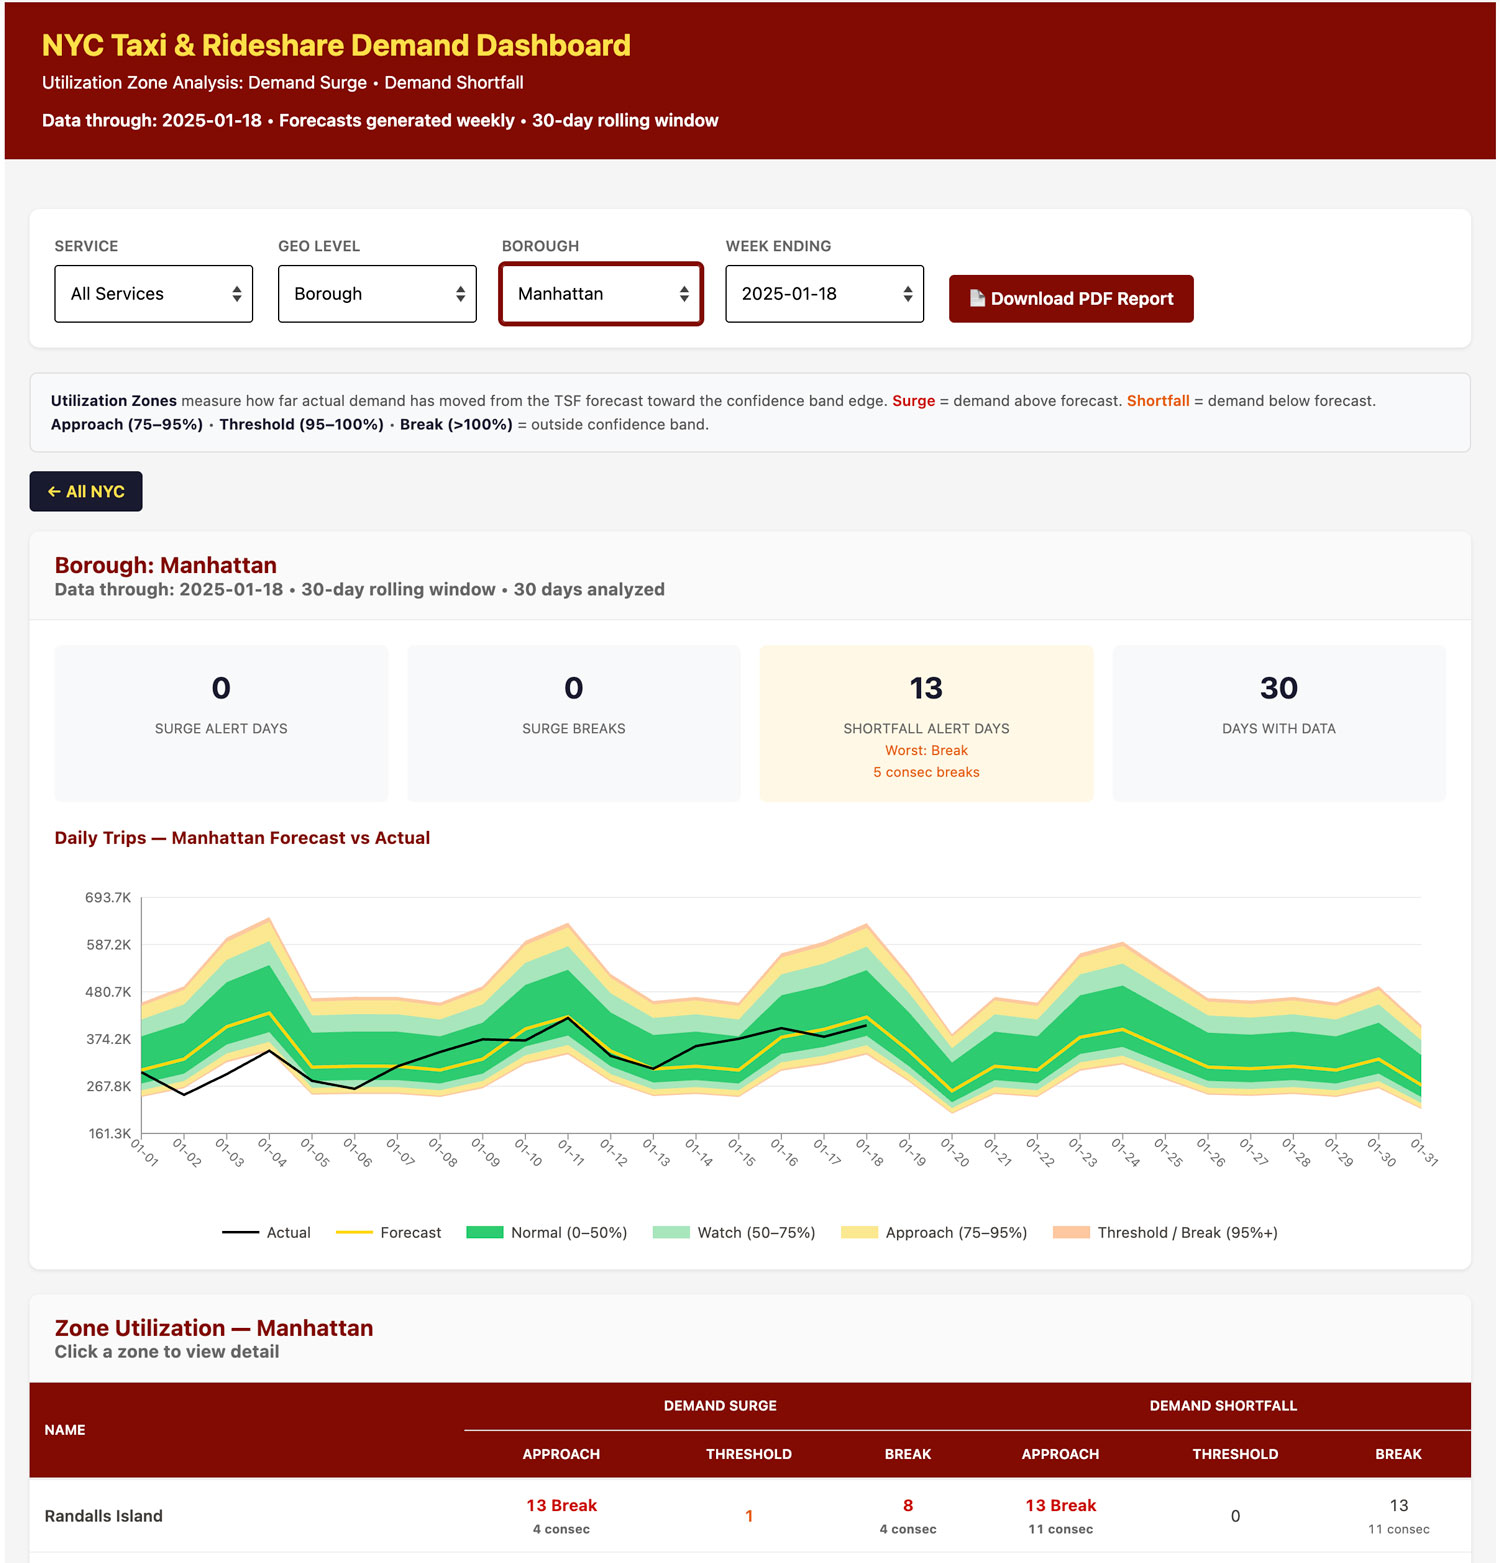
Explore the NYC Taxi & Rideshare Demand Dashboard →
Demand Capacity Planning:
How to Use the Map of Normal
Capacity planning monitors proximity to the upper and lower bands as well as band breaks. The strategies below define exactly what those decisions are, and when to make them.
In retail and manufacturing, inventory persists — you can build ahead, hold stock, and absorb a demand surge from existing supply. The cost of running short is high, so the planning target is the top of the confidence band. Capacity planning works differently. A staffed shift that goes unused, a vehicle deployed to a route with no demand, a gate agent scheduled for a flight that never fills — these are costs with no recovery. Overcapacity is waste. Undercapacity is a service failure. The goal is not to avoid stockouts. The goal is to hit the number.
In demand capacity planning, you plan to the gold line — the TSF forecast value itself. Your capacity buffer is determined by the most recent volatility of that specific entity: how much actual demand has been moving relative to the forecast in recent periods. An entity whose actuals track closely to the gold line supports a tight resource plan. An entity whose actuals move around more requires a larger buffer.
Utilization Zones
The confidence band is divided into four zones that measure how far actual demand has moved from the forecast toward the band edge. Each zone applies to both Demand Surge (actuals above forecast) and Demand Shortfall (actuals below forecast).
Normal (0–50%): Actuals are close to the forecast. No action required.
Watch (50–75%): Demand is drifting from the forecast. Monitor for continuation.
Approach (75–95%): Demand is moving toward the band edge. Prepare to adjust capacity.
Threshold (95–100%): Demand is at the edge of the confidence band. Action is likely required.
Break (above 100%): Actual demand has moved outside the confidence band entirely. Conditions are not normal. Immediate response required.
Reading the Dashboard
When actuals track closely to the gold line—as they do for most entities in the NYC transportation dataset—the forecast is reliable and capacity can be planned tightly. When actuals drift into the Watch or Approach zones consistently, the buffer for that entity needs to be increased. A Break is not a forecast failure. It is the signal the system is designed to fire: conditions have changed and the plan needs to change with them.
See What TSF Demand Can Do For Your Business
Every TSF Demand engagement starts with a free consultation. We review your data environment, walk through your planning needs, and give you a clear picture of what the service would look like for your business. You decide what happens next.