
TSF Demand is a fully managed service. We connect directly to your data environment, build your forecast infrastructure, run your planning pipeline daily, and deliver structured reports on a cadence that fits your decision cycle. Nothing requires setup, maintenance, or oversight on your end.
Impact analysis answers a question every organization asks but rarely answers cleanly: did this intervention actually work, or did conditions change for reasons that had nothing to do with it? Without a structural baseline, the answer is always ambiguous.
Environmental Monitoring Emissions levels, air and water quality metrics, and pollution indicators are continuous time series tracked against regulatory thresholds. A structural baseline establishes what normal looks like before and after an intervention — making compliance outcomes measurable and defensible.
Public Health Disease rates, hospitalization rates, and mortality rates are tracked daily and weekly with a level of data quality that makes structural analysis reliable. The intervention question — did a policy, a program, or a treatment protocol actually change outcomes — is measurable against the structural baseline.
Infrastructure Investment Traffic volume, transit ridership, and accident rates are tracked continuously before and after capital investment. The structural baseline determines whether the investment actually moved the outcome or whether conditions were already shifting independently.
Supply Chain Disruption Analysis Did a supplier change, a logistics restructuring, or a new fulfillment center actually improve delivery performance? Structural baseline lead times and fill rates separate the signal from the noise.
Equipment and Maintenance Did a predictive maintenance program or an equipment upgrade actually reduce failure rates and downtime? The answer requires a structural baseline performance curve — not a before-and-after average.
Public Safety Did a policing strategy, a curfew, or a community program actually reduce incidents? Structural baselines for crime and incident rates by location and time period separate the effect of the intervention from independent structural change.
On-Time Performance Carrier performance, fulfillment accuracy, and delivery reliability are tracked continuously. Structural baselines identify whether service degradation is a vendor problem or a demand-driven capacity issue.
TSF Demand Impact Analysis Dashboard Example
The TSF Demand Dashboard gives you a live, real-time view of your Map of Normal—the confidence bands that define what demand should look like for every entity in your business at every point in time. Every forecast, every band, and every signal is visible at the entity level and across every aggregate dimension in your data.
The Environmental Monitoring dataset below shows the dashboard applied to ozone levels and air quality tracked and monitored by the EPA. Explore the live version to see TSF forecasts across the full dataset—by state, county, metropolitan area, or monitoring site, with 30, 60, or 90-day views.
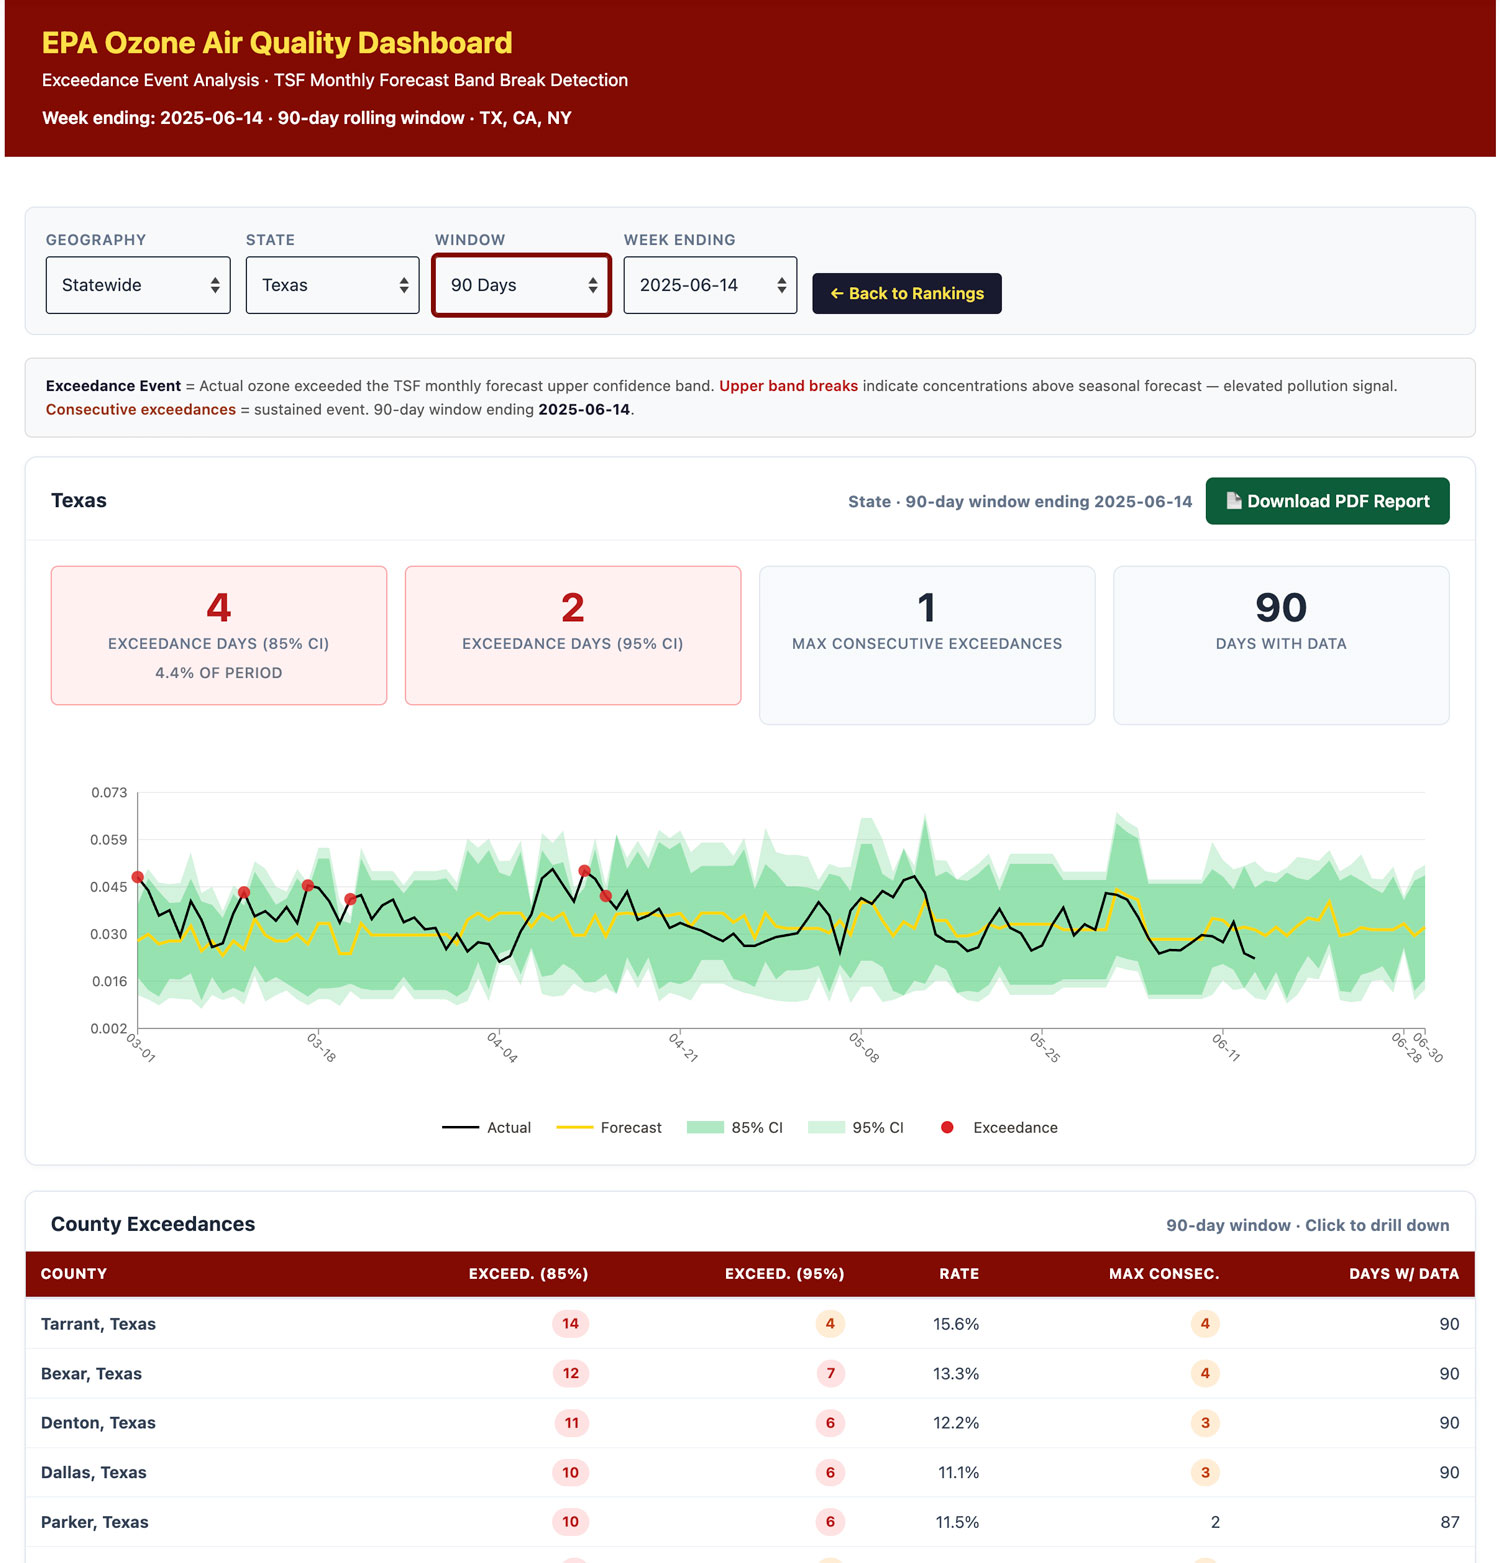
Explore the EPA Ozone Air Quality Dashboard →
Impact Analysis:
How to Use the Map of Normal
Environmental monitoring establishes a structural baseline for each monitoring entity: the expected ozone concentration for each day, and the expected rate at which actual readings will exceed the forecast confidence bands over any given period. Under normal conditions, a small number of band breaks is expected. The TSF confidence bands are calibrated so that some exceedances are statistically normal. What matters for impact analysis is not whether exceedances occur, but whether their frequency and duration change.
A critical distinction: exceedances in this context are measured against the TSF forecast confidence bands, not against regulatory thresholds like the EPA's NAAQS standards. A TSF exceedance means actual ozone ran higher than the structural forecast baseline for that site, not that a legal limit was crossed. This makes the metric appropriate for measuring improvement rather than compliance. Regulatory violation analysis requires a separate framework.
Defining the Baseline
The Map of Normal for each monitoring site is established from its historical forecast record: the typical number of exceedance days per rolling window, the typical exceedance rate as a percentage of the analysis period, and the typical maximum consecutive exceedance run. These three figures—exceedance days, exceedance rate, and consecutive run length—define what normal looks like for that specific site before any intervention.
Measuring Impact
An intervention is measured by comparing the post-intervention exceedance profile against the established baseline. A successful intervention produces a sustained drop in exceedance days, exceedance rate, and consecutive run length relative to what the structural baseline predicted. The dashboard tracks all three metrics at the site level, county level, CBSA level, and state level, making it possible to measure whether an improvement at one site reflects a genuine local change or is part of a broader regional shift in conditions.
See What TSF Demand Can Do For Your Business
Every TSF Demand engagement starts with a free consultation. We review your data environment, walk through your planning needs, and give you a clear picture of what the service would look like for your business. You decide what happens next.