
TSF Demand is a fully managed service. We connect directly to your data environment, build your forecast infrastructure, run your planning pipeline daily, and deliver structured reports on a cadence that fits your decision cycle. Nothing requires setup, maintenance, or oversight on your end.
Sales and operational planning aligns demand, inventory, supply, and production into a single operating plan. When demand timing is wrong, every commitment downstream of it is wrong.
Big Box Retail: Thousands of SKUs across hundreds of locations. Mistimed replenishment means excess stock in declining categories and empty shelves in accelerating ones — with markdown decisions, promotional timing, and supplier orders all paying the price.
Retail Grocery: Fresh and perishable categories have zero tolerance for forecast error. Overstock is waste. Understock is a lost sale that doesn't come back.
Consumer Retail: Seasonal transitions, new product introductions, and promotional lifts create recurring structural shifts. Inventory commitments made on lagging signals produce the wrong assortment at the wrong time.
Consumer Packaged Goods: Production runs, procurement, and distribution commitments are made weeks or months in advance. A demand signal that can't identify acceleration or deceleration makes every one of those commitments a guess.
Manufacturing: Capacity planning, procurement, and production scheduling all flow from the demand plan. Late signals mean late adjustments — and late adjustments mean expedited costs or missed delivery windows.
Online Retail: Fulfillment commitments, warehouse positioning, and promotional spend all depend on current structural conditions. A lagging signal puts the wrong inventory in the wrong fulfillment center at the wrong time.
Restaurant: The planning horizon is days, not weeks. Spoilage, waste, prep labor, and procurement are all determined by near-term demand. A timing signal that identifies shifting traffic patterns gives operators the lead time to adjust before the cost hits.
TSF Demand Sales & Operational Planning Dashboard Example
The TSF Demand Dashboard gives you a live, real-time view of your map of normal—the confidence bands that define what demand should look like for every entity in your business at every point in time. Every forecast, every band, and every signal is visible at the entity level and across every aggregate dimension in your data.
The Walmart M5 dashboard demonstrates TSF Demand applied to a real big box retail environment at scale, tracking band breaks across stockout risk, overstock risk, and revenue shortfall at every level of the product and location hierarchy. The dashboard displays rolling 30-day monthly or 90-day quarterly forecast windows for Units and Revenue, with 85% and 95% confidence bands rendered against actual performance. From the top-level executive summary across all locations, the analysis drills down through state, store, department, and category. SKU-level band break data is available for Store CA_1 as a representative example of the full atomic forecast capability. Any view of the data—any combination of report type, geography, forecast horizon, and time period—can be exported as a formatted PDF report with a single click, ready to drop into a planning meeting without additional preparation.
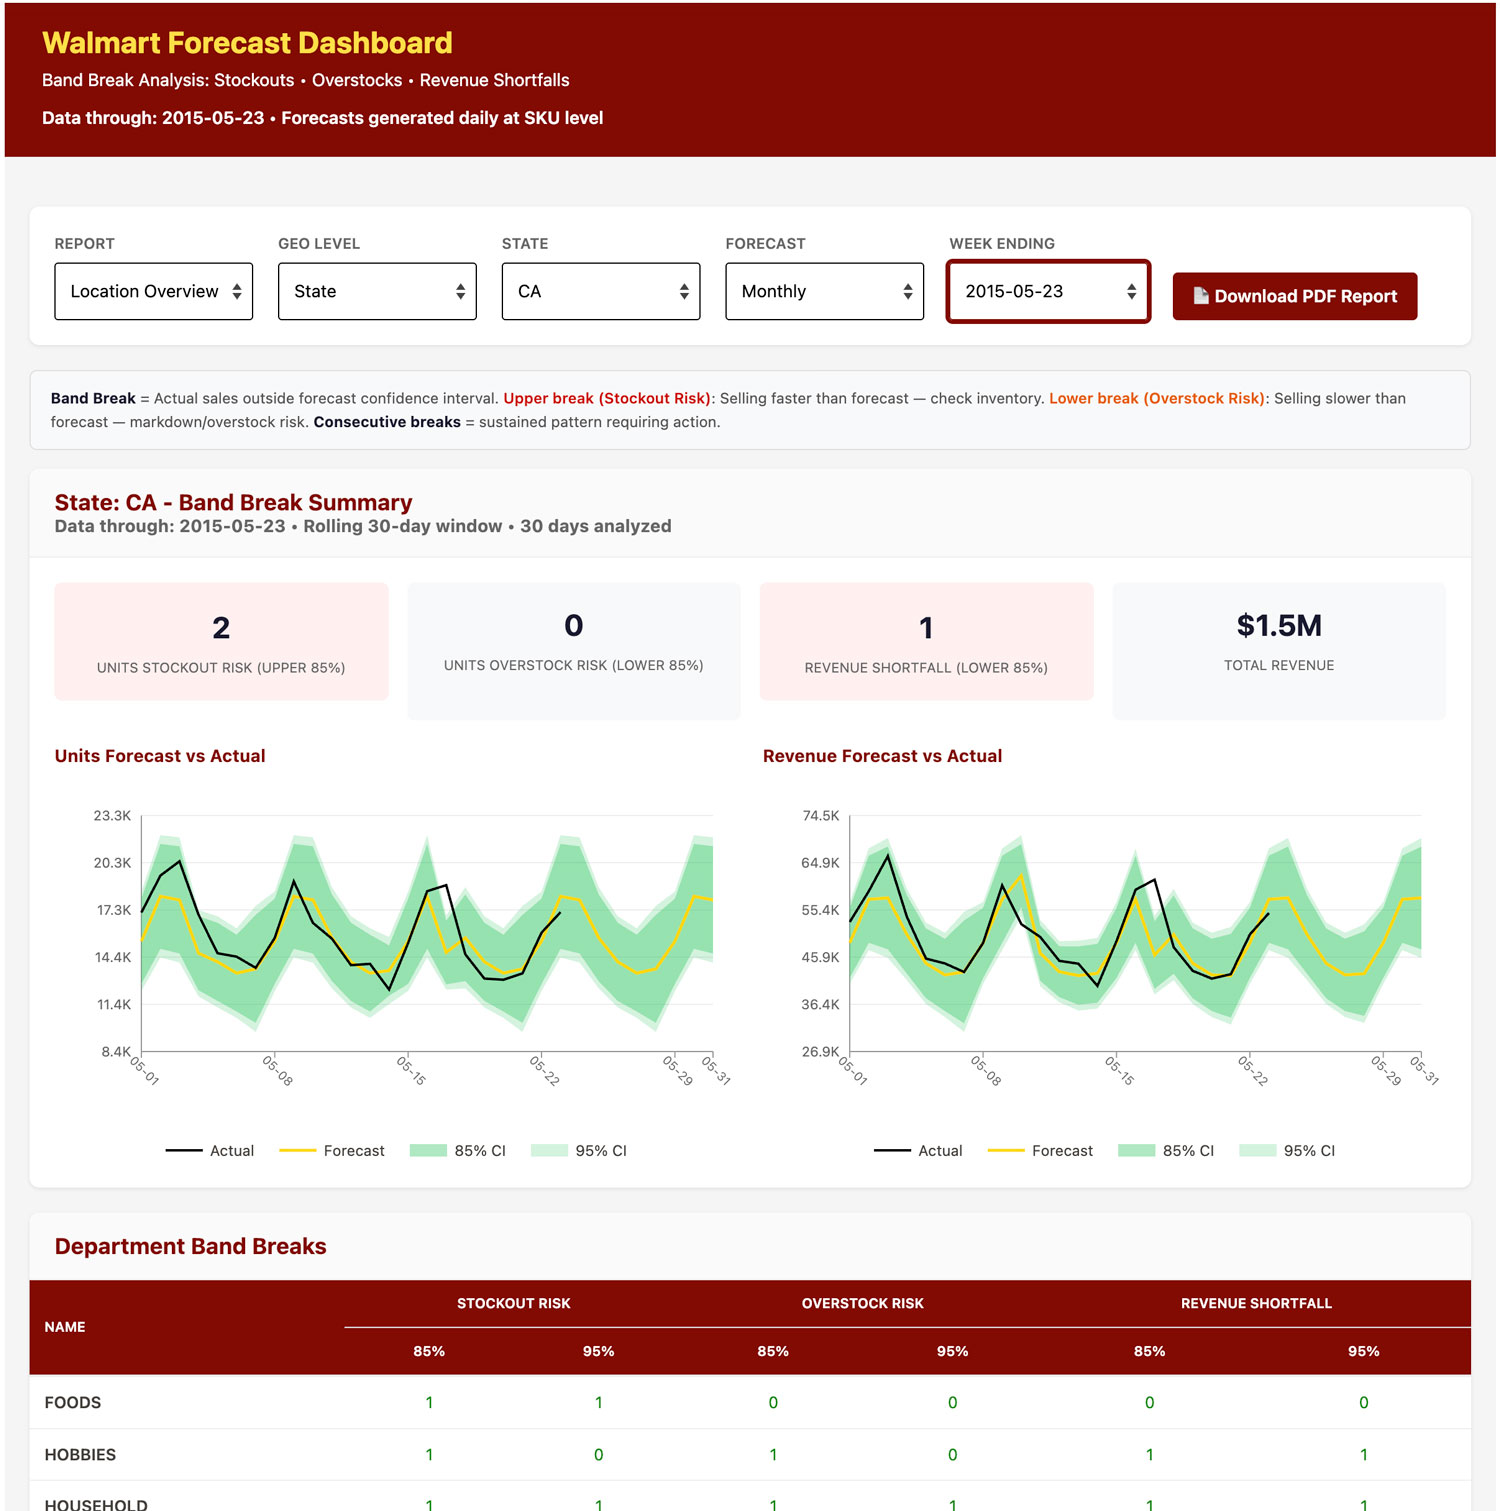
Explore the live Walmart M5 Dashboard →
The band breaks you see in the dashboard are not forecast errors—they are signals. Each one marks a moment when actual demand moved outside the range of normal conditions, and each one represents a decision point. The strategies below define exactly what those decisions are, and when to make them.
Sales & Operations Planning:
How to Use the Map of Normal
Monthly and quarterly forecast maps make planning possible: plan to the upper band limits to avoid stockouts, or use the lower band limits to avoid overstock.
When Sales actuals approach or break the upper band, demand is running higher than expected and inventory is depleting faster than the plan anticipated. Reorder now to avoid stockouts and lost sales.
When Sales actuals approach or break the lower band, demand is running below expectations and inventory is accumulating. This is when to consider running promotions, lowering prices, or moving inventory.
When Units actuals approach or break the upper band, inventory levels are abnormally high. This is an overstock signal — too much stock on hand relative to the structural baseline, regardless of current sales performance.
When Units actuals approach or break the lower band, inventory is depleting. Confirm whether this reflects strong sales demand or a supply problem that requires immediate attention.
When actuals approach or break the lower band of Revenue forecasts, it is a signal to adjust the overall marketing and pricing strategy. When actuals approach or break the upper band of Revenue forecasts, your plans are performing as expected — monitor Sales and Units to make sure supply can keep up with demand.
Forecast Strategies
TSF Demand generates forecasts at the atomic entity level — the individual SKU at the individual location through the individual channel — and rolls those forecasts up through every dimension in your data.
Entity-Level Tracking
Every atomic entity in your business can be tracked and forecasted across three metrics. Each one measures a different aspect of demand and serves a different planning function.
Units measures the quantity of product moving through the business. It is the input to inventory planning, replenishment decisions, and supply chain commitments.
Sales measures the number of transactions occurring at the entity level. It is the input to demand pattern analysis, promotional evaluation, and customer behavior tracking.
Revenue measures the dollar value of demand at the entity level. It is the input to financial planning, margin analysis, and budget performance tracking.
A structural shift in demand will manifest differently across all three metrics depending on its origin. A price change moves revenue without affecting units or sales counts. A volume shift moves units and flows through to revenue. A traffic change moves sales counts and carries units and revenue with it. Tracking all three independently at the atomic level means the nature and origin of any structural shift is visible from the moment it occurs.
Aggregate Dimensions
Atomic entity forecasts roll up through every dimension in your data, producing a complete picture of demand structure at every level of the business.
Product dimensions roll up from individual SKU to sub-category, category, and department, allowing structural shifts to be identified at the item level and tracked as they propagate through the product hierarchy.
Location dimensions roll up from individual store or fulfillment location to region, state, and country, allowing geographic demand patterns to be tracked at the level where they originate and monitored as they aggregate.
Channel dimensions separate online and in-person demand into independent forecast streams, identifying structural differences in how demand behaves across channels and how those differences affect inventory positioning and fulfillment decisions.
Every combination of metric, product dimension, location dimension, and channel dimension produces an independent forecast and monitoring stream, all from a single data connection to your existing systems.
Seasonal Items
Seasonal Items receive their own sets of forecasts using seasonal models that are bound to the calendar month. This approach captures the natural ramp-up and ramp-down of seasonal items and guarantees that planning is based on accurate historical patterns. Planning for next year’s season can begin the day after this year’s season ends because forecasts for seasonal items can be generated a full year in advance.
Note that seasonal item forecasts require a minimum of 3-5 years of historical seasonal data.
Retail Promotions
The Sales and Operational Planning dashboard supports both the planning and real-time evaluation of retail promotions.
The map of normal identifies exactly where promotions are needed. Products and categories with actuals running below the lower band on Sales are underperforming relative to their own structural baseline. Products with Units actuals above the upper band are overstocked. These are the targets: not categories that feel slow, but entities where the data confirms the problem.
Revenue forecasts provide the pricing framework. The upper and lower band limits on Revenue define the range of normal performance and establish the boundaries for promotional pricing decisions.
Once a promotion is running, the map of normal measures its impact directly. Promotional lift shows up as Sales actuals trending higher against the forecast baseline: a measurable, objective signal that the promotion is working, without the ambiguity of comparing against a prior period.
The same signal that confirms a promotion is working also tells you when to pull back. If Sales actuals approach or break the upper band during a promotional period, demand has exceeded the forecast baseline and inventory is depleting faster than expected. Scale back the promotion in real time before the stockout risk becomes a stockout.
See What TSF Demand Can Do For Your Business
Every TSF Demand engagement starts with a free consultation. We review your data environment, walk through your planning needs, and give you a clear picture of what the service would look like for your business. You decide what happens next.